
Next-generation Chart
Prime Market Terminal equips you with powerful charting tools combined with advanced data so you can instantly spot the best trades!
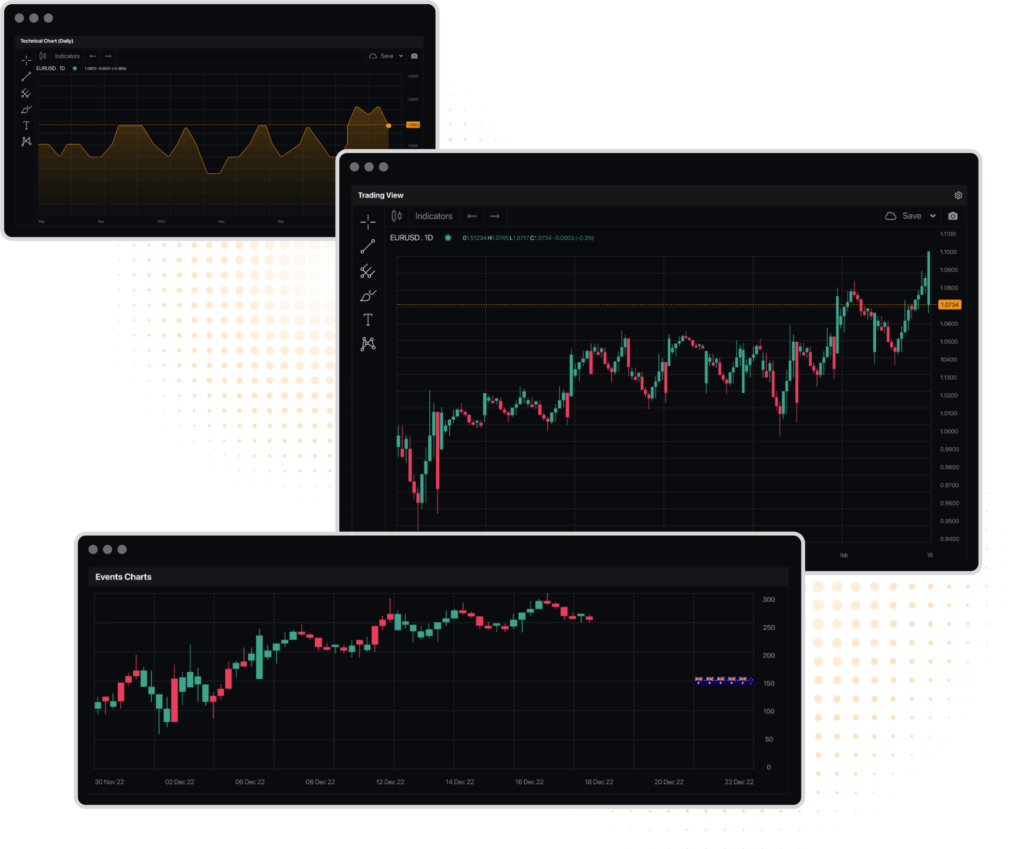
Unlimited Tradingview Charts
Our Users have access to numerous chart types, drawing tools, and technical indicators for conducting in-depth market analysis. Thanks to TradingView’s most advanced charting library we able to offer a wide range of functionalities designed to cater to the needs of traders and investors.
Our charts provides various chart types to accommodate different trading styles and analysis methods. These include but are not limited to – Line Charts, Candlestick Charts, Bar Charts, Heikin Ashi, Renko, Kagi, Point & Figure, Line Break Each – chart type offers unique insights, allowing users to visualize market movements in ways that best suit their trading strategy. With PMT you have the possibility to create customized dashboard with unlimited charts.
Over 100 pre-built technical indicators such as Moving Averages, RSI, MACD, Bollinger Bands, and more. Drawing tools that allow traders to annotate charts with trend lines, channels, Fibonacci retracements, and custom shapes. The charts are connected to real-time data for a vast range of instruments across various markets, including stocks, forex, cryptocurrencies, futures, and indices.

Pattern Scanner
We developed the most advanced Candlestick Pattern Scanner in the whole industry. Common chart patterns, such as the Pinbar Pattern and others, play a minor part in our role. The PMT Pattern Scanner operates on a foundation of statistical analysis, initiating with the current chart formation identified as a significant pattern. Our advanced algorithm meticulously scans through all historical data to match the current pattern with similar past chart formations. Unlike traditional analysis methods, our Pattern Scan algorithm is adept at recognizing new patterns in price data that have not been observed before.
Concerns over the freshness or precision of data are eliminated by our cutting-edge forecasting technology, which employs vector algorithms and fuzzy logic. This allows us to incorporate the most recent developments in our price data analysis, ensuring our approach remains relevant even as market dynamics evolve over time. Our algorithm’s self-learning capability ensures it adapts to long-term changes in the market. Moreover, you’ll receive a precise trading recommendation based on real-time predictions. Seize the opportunity to access trading forecasts ahead of other market participants, allowing you to immediately capitalize on your insights for profit.
Market Structure Charts
PrimeMarket Terminal provides you with the ability to swiftly discern the market’s structure, sparing you from potential mistakes and conserving your valuable time and effort. To facilitate this, we introduce two essential tools: “Supply and Demand Areas” and “High/Low Points.”
The “Supply and Demand Areas” tool is designed to pinpoint zones that have been tested repeatedly on a daily chart, eliminating the need for you to manually search for potential zones. This feature allows you to effortlessly transfer information about these zones directly to your personal chart, providing a comprehensive view of possible zones for the selected currency pair without wasting time.
On the other hand, the “High/Low Points” tool highlights the highest and lowest points on a daily chart for a chosen currency pair. This tool goes a step further by offering detailed insights about significant points that the market has historically formed. Together, these tools enhance your trading strategy by offering quick access to critical market structure insights, enabling informed decision-making.
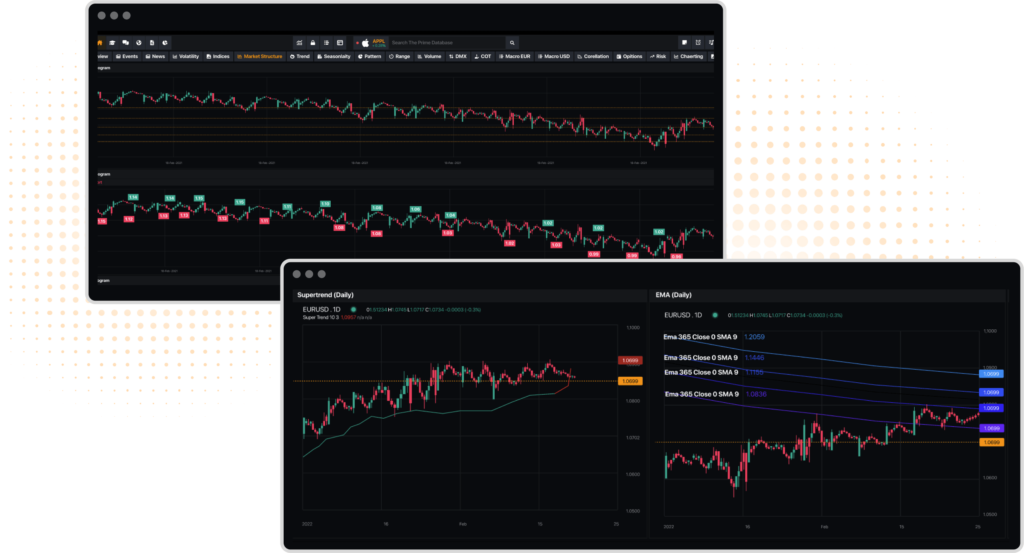
Trend-finding Tools
Opt for the PMT to automate the process of analyzing price movements and spotting trends. Our sophisticated algorithms diligently comb through charts across various timeframes to identify the most dependable trends. It’s essential to understand that prices tend to follow a sequence of highs and lows, rather than moving linearly. To effectively tackle this characteristic, PMT leverages specific criteria such as trend density, deviation from the regression line, and the proximity of data points to the trend’s peak and trough.
While many traders traditionally resort to manually reviewing charts and drawing trend lines to detect trends, this approach can be subjective and prone to human error. The allure of manual analysis lies in the personal engagement and reasoning it involves, which can be an intriguing aspect of trading. However, this method also opens the door to biases and inaccuracies, as traders might see the trends they hope to find rather than those actually present.
This is where PMT stands out by offering a more reliable and efficient alternative. Our algorithms automatically identify High and Low Points along with the current Trend Phase, eliminating the need for subjective interpretation and significantly reducing the time spent on analysis. Along with the Supertrend and institutional Exponential Moving Averages you ensure that your trading decisions are based on accurate, unbiased, and comprehensive trend analysis, giving you a clearer path to informed trading actions.
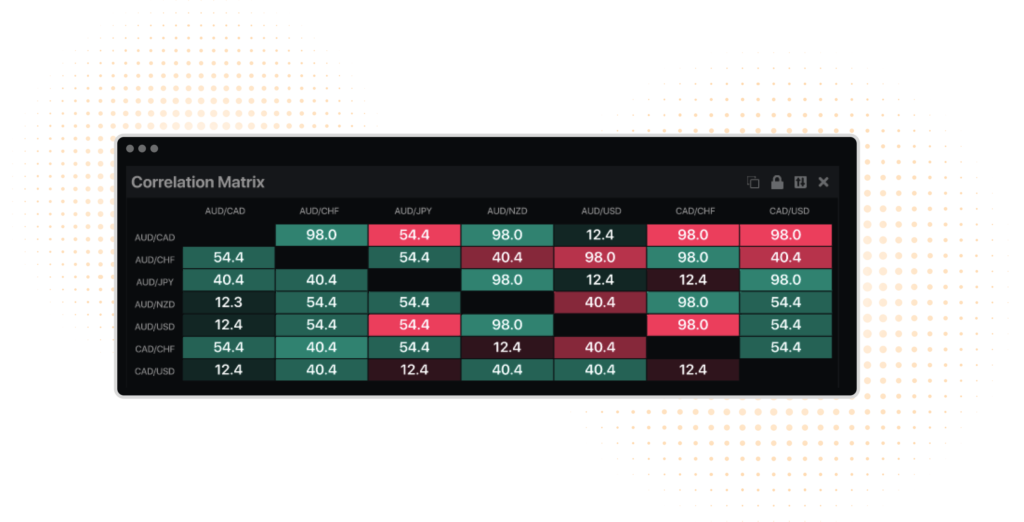
Correlation Matrix
The Correlation Matrix is used by traders and investors to understand and analyze the relationship between various currency pairs in the forex market or other asset classes. It measures how changes in the price move of one assets could affect the price of another assets. This relationship is quantified on a scale and known as the correlation coefficient.
By understanding the correlation between currency assests, traders can manage risk more effectively. If two pairs are highly correlated, opening positions in both could double the risk as they are likely to move in the same direction. Conversely, if pairs are negatively correlated, a position in one can be hedged by taking a position in the other, potentially reducing risk. Also the matrix helps in portfolio diversification. By choosing assets with low or negative correlations, traders can spread their risk, as these assets are less likely to move in the same direction at the same time. Also you can use the correlation matrix to identify potential trading opportunities. For example, if two currencies are positively correlated and one moves significantly but the other does not, it might indicate a potential catch-up trade.
Changes in correlations can provide insights into broader market sentiments or shifts in economic fundamentals. For instance, if traditionally correlated assets begin to move independently, it might indicate a change in market conditions.
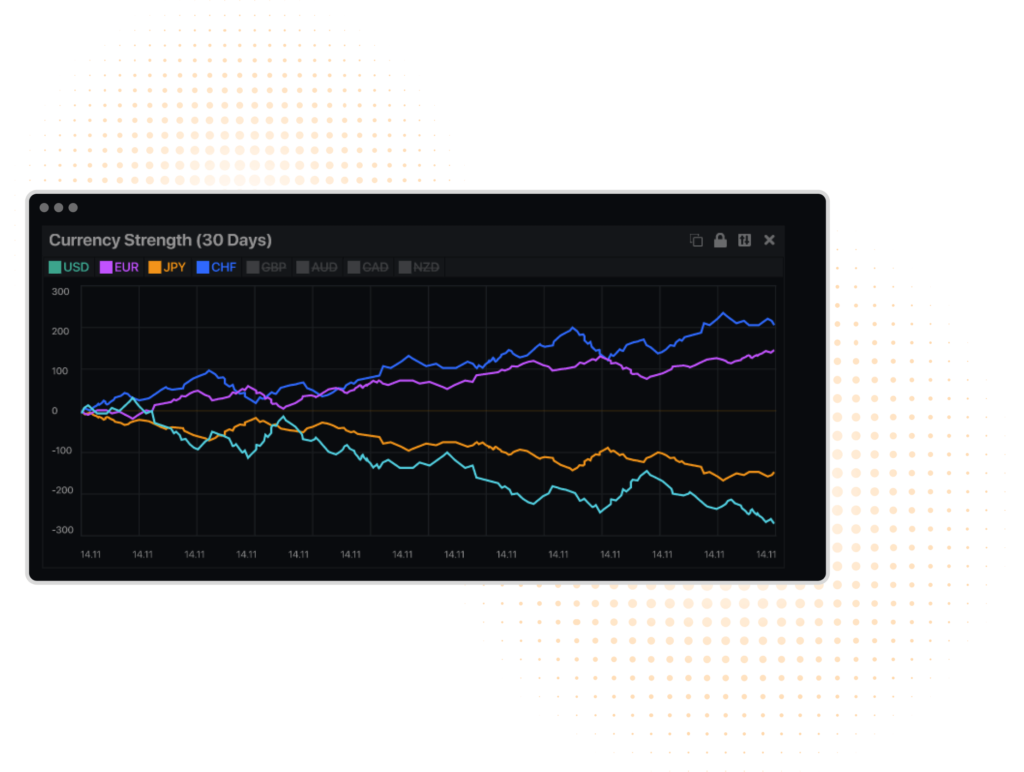
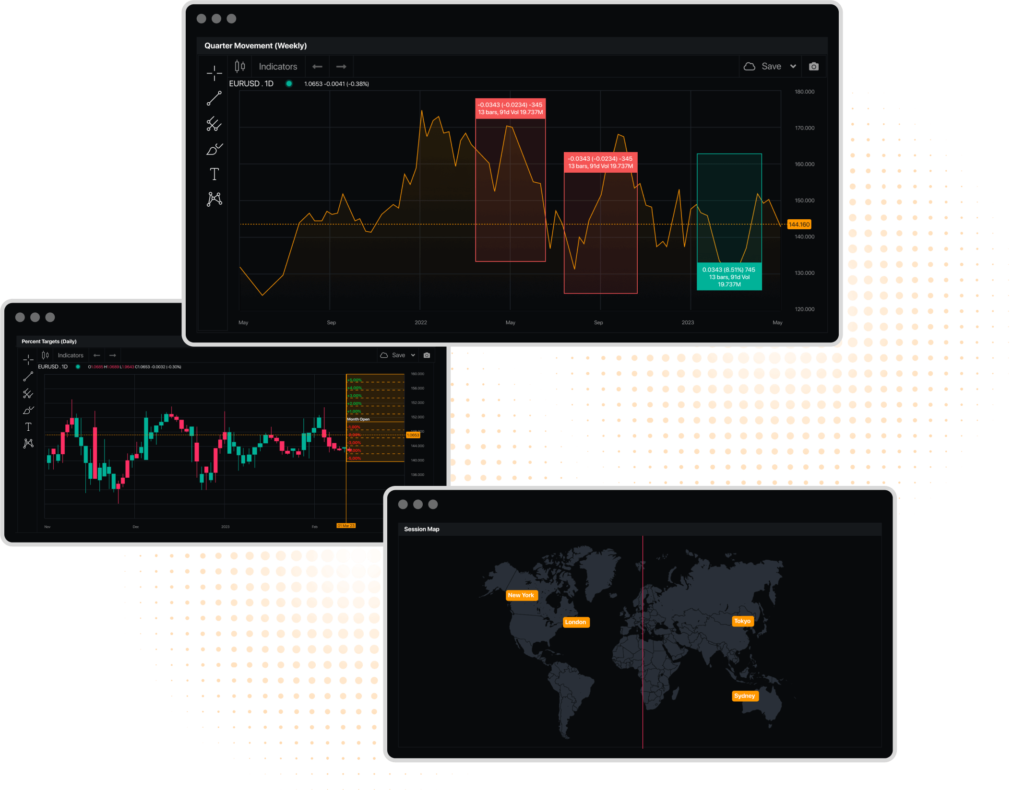
Currency Strength Charts
A Currency Strength Chart is a visual tool used by forex traders to compare the strength of various currencies relative to others in real-time. This chart helps traders identify which currencies are strong and which are weak at any given moment, based on various factors including economic indicators, interest rates, and overall market sentiment. The strength is typically measured over a specific time frame, and the chart displays this information in an easily interpretable format, often through bars, lines, or other graphical representations.
Each currency is represented by a line or bar, with different colors for easier distinction. The length or position of these lines/bars indicates the relative strength or weakness of the currencies. Updates in real time, reflecting changes in the market instantly. You can adjust the time frame for the analysis, such as looking at the strength over the past hour, day, or week. This flexibility helps in both short-term trading and long-term BIAS.
Many other functions and widgets inside PMT
Gain access to a wealth of professional research within PMT, authored by industry experts and analysts. Dive deep into insightful research, market analysis, and investment strategies to enhance your understanding of various sectors, asset classes, and specific investment opportunities.
Read the news that moves the markets first to capitalize on the next big trends before the world knows about it. Utilize Realtime Headline Tickers, wide News Coverage and a complete Reading Desk to always stay ahead of the curve.
All rights received , © 2023 - 2024 - PrimeMarket Terminal